Three Years of Activity of the FCDMH: Progress and Challenges for the future
Three Years of Activity of the FCDMH:
Progress and Challenges for the future
Fukushima Center for Disaster Mental Health(FCDMH)
Genshiro Hiruta, M.D., Director
Introduction
On March 11, 2011, many coastal cities, towns and villages in Fukushima prefecture suffered serious damage due to a strong magnitude 9 earthquake and the huge tsunami that followed. 15,113 houses were completely destroyed and 219,454 houses were severely or partially damaged.
To make matters worse, Fukushima’s Number 1 nuclear power plant, owned by the Tokyo Electric Power Company (TEPCO), which was located on the seacoast, was severely damaged and experienced a meltdown. It was the worst atomic power plant accident in human history.
Fukushima’s Number 1 nuclear power plant had not reached cold shutdown status as of August, 2015, and the unstable condition continues today. Moreover, human casualities in Fukushima prefecture as of September 2015 totalled 3,793 including both confirmed dead and reported missing.
To protect their children from radiation exposure, many concerned parents evacuated from Fukushima immediately after the nuclear accident. The number of evacuees reached a peak of around 164,000 people in June 2013. As of August 2015, 107,703 people still remain evacuated in every region of Japan.
In fiscal year 2015, 65,300 people remained evacuated within Fukushima prefecture. The Center is providing support to 1,609 evacuees (the accumulated number is 6,164) in the current year. In addition, we are providing support services to people who remain in evacuation status outside of Fukushima prefecture by means of a telephone consultation program called the “Fukucoco Line”.(note: Every years in this text are written in fiscal years of Japan that covers from April to March of next year)
Ⅰ. Support Services for Disaster Victims
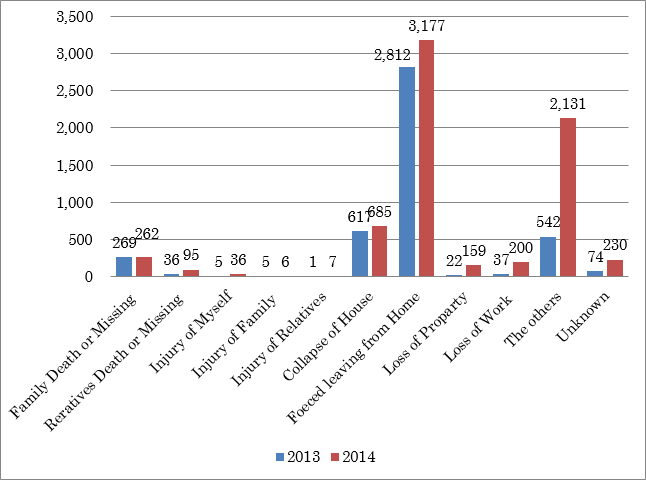
1. Damage in Fukushima (Chart 1)
In the two years of 2013 and 2014, many people were forced to leave their hometowns. 2, 812 people in 2013 and 3,177 people in 2014 evacuated from their hometowns. The second largest number of people, 617 people in 2013 and 685 people in 2014, left their hometowns due to the collapse of their houses. The number of dead or missing totalled 269 people in 2013 and 262 people in 2014.
Chart 1. Disaster Status in Fukushima (2013~2014)
2. Consultation Services (Chart 2)
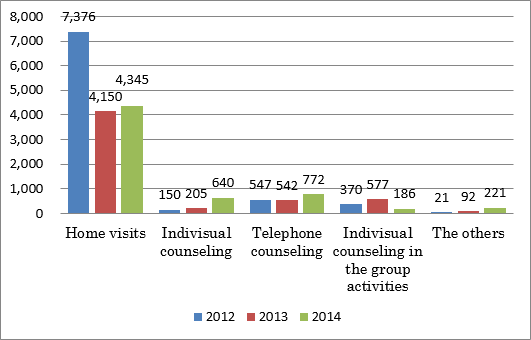
Our center has been providing counseling and consultation services for disaster victims. The total number of recipients of these services was 8,464 people (705.3 people per month) in 2012, 5,556 people (463.8 people per month), and 6,164 people(463.8 people per month) over the three years.
The average number of people who received our support services was 1,386 people in 2013 and 1,609 people in 2014. In comparison with last year, the number of people who received our support increased by 223 in 2014. This increase was due to the initiation of consultation support for local government officials in a program we call “helping the helpers”.
Regarding the support we provide to evacuees, home visits are the most common and important approach. Home visits were made to 7,377 (87.2%) people in 2012, to 4,150 (74.6%) people in 2013, and to 4,345 (70.5%) people in 2014.
The second most important type of support is telephone consultation. Telephone counseling was provided to 547 (6.5%) people in 2012, 542 (9.7%) people in 2013 and 772 (12.5%) people in 2014. Telephone counseling functions as a type of consultation, and the need for this type of service is increasing year by year.
The number of group counseling activities increased from 370 (4.4%) people in 2012 to 577 (10.4%) people in 2013, then decreased to 186 (3.0%) people in 2014. On the other hand, the number of private conseling sessions has increased from 150(1.8%) people in 2012 and 205(3.7%) people in 2013 to 640(10.4%) people in 2014. The increased need for private counseling is possibly due to two factors: (1) the individual and widening needs of evacuees and (2) the establishment of counseling rooms in all of the regional offices.
Chart 2. Consultation Services
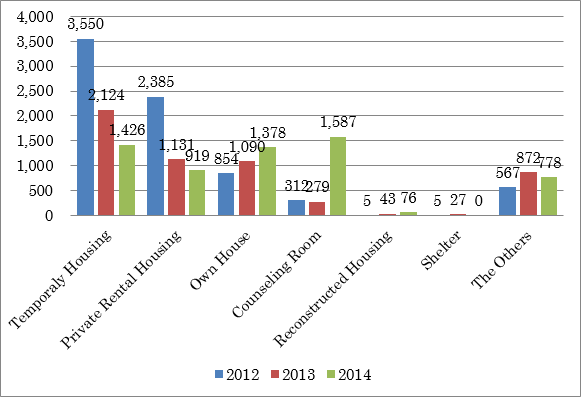
3. Location of Services Provided (Chart 3)
The most frequent locations for staff visitations were temporary housing. The number of people in temporary housing has been decreasing year by year, from 3,550 (46.2%) people in 2012, to 2,124 (38.2 %) people in 2013、and 1,426 (23.1%) people in 2014.
On the other hand, the number of visits to clients’ permanent residences has been increasing from 854 (11.1%) people in 2012 to 1,090 (19.6%) people in 2013 and 1,378 (22.4%) people in 2014.
Chart 3. Location of Services Provided and Number of Consultations
4. Number of Clients for Consultation
The number of people who came to our offices was 2,220 (89.4%) people in2012,
4,931 (88.6 %) people in 2013 and 5,312 (86.2%) people in 2014.
In some cases, the person concerned did not come to our offices but, rather, a family member came for consultation. The number of people involved in this type of consultation was 241 (9.7%) people in 2012, 527 (9.5%) people in 2013, and 616 (10.0%) people in 2014.
5. Gender and Ages
The number of female clients was slightly larger than the number of males: 1,422 (57.3%) females in 2012 (November 2012-March 2013), 3,121 (56.1%) females in 2013, and 3,503 (56.8%) females in 2014.
The number of people between 16 and 64 years old who used our support services amounted to 1,230 (50.3%) people in 2112, 3,085 (55.4%) people in 2013, and 3,930 (63.8%) people in 2014.
The requests for our services from elderly people of 65 years old or older totalled 1,008 (44.5%) people in 2012, 2,092 (37.6%) people in 2013, and 1,854 (30.1%) people in 2014.
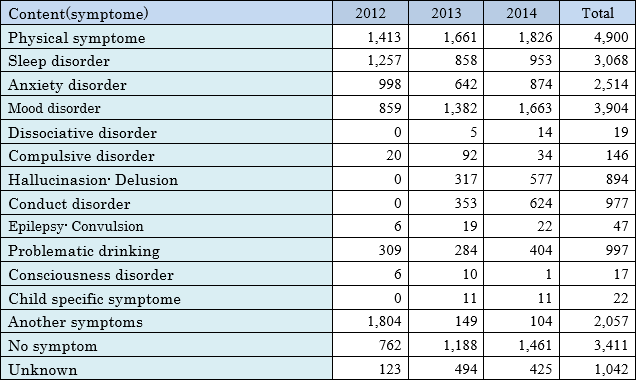
6. Symptoms Addressed during Consultations (Table 1)
The most frequent symptom addressed in consultation sessions over the 3 years was “the concern for physical condition”; a total of about 4,900 people expressed this concern.
The second largest number of people complained about “bad feelings and emotions.” 859 (11.4%) people in 2012, 1,382 (18.5 %) people in 2013, and 1,663 (18.5%) people in 2014 complained about feeling depressed.
The third was “sleep disorders,” as 1,257 (16.6%) people in 2012, 858 (11.5 %) people in 2013, and 953 (10.6%) people in 2014 complained about insomnia.
The fourth largest number of complaints concerned “anxiety”as 998 (13.2%) people in 2012, 642(8.6%) people in 2013, and 874 (9.7%) people in 2014 suffered from anxiety.
The number of people with “drinking problems” was 309 (4.1%) people in 2012, followed by 284 (3.8 %) people in 2013, and 404 (4.5 %) people in 2014.
In summary, many of those (10 to 20 % )who came for consultation suffered from acute symptoms such as “poor physical condition,” “bad feelings and emotional liability,” “anxiety symptoms” and “sleep disorders”.
The number of clients with “drinking problems” was relatively small.
The number of clients who responded “no symptoms” has been increasing every year as follows: 762 (10.1 %) people in 2012, 1,188 (15.9 %) people in 2013, and 1,461 (16.2 %) people in 2014.
Table 1. Symptoms Addressed during Consultations
7. Issues Expressed during Consultations (Table 2)
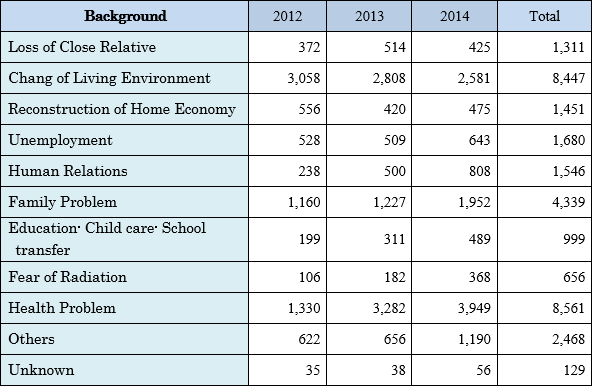
Over the 3-year period, “health problem” was the issue most frequently expressed by clients. These numbers were 1,330 (15.8%) people in 2012, 3,282 (31.4 %) people in 2013, and 3,949 (30.5%) people in 2014.
The second most frequently stated issue related to “a change of residence”. The following number of people came for consultation regarding this issue: 3,058 (36.2%) people in 2012, 2,808 (26.9 %) people in 2013, and 2,581 (20.0%) people in 2014.
The third most frequent issue was “family and home problems”. There were 1,160 (13.7%) cases in 2012, 1,227 (11.7 %) in 2013, and 1,952 (15.1%) in 2014.
“Unemployment and/or working problems” was the fourth most frequent issue. 528 (6.3%) people in 2012, 509 (4.9 %) people in 2013, and 643 (5.0%) people in 2014 came to consult regarding this issue.
The fifth issue was the problem of “human-relations”, 238 (2.8%) people in 2012, 500 (4.8%) people in 2013, and 808 (6.2%) people in 2014 consulted with our staff members regarding this problem.
The sixth most frequent issue was “economic problems relating to reconstruction”,
556 (6.6%) people consulted with our staff’ about this issue in 2012, 420 (4.0%) people in 2013, and 475 (3.7%) people in 2014.
The number of people who experienced “the loss of close relatives” was 372 (4.4%) in 2012, 514 (4.9 %) in 2013, and 425 (3.3%) in 2014.
Table 2. Issues Expressed during Consultations
8. Present Medical Treatment(Chart 4)
We asked our clients, who in addition to consulting with us make regular visits to their local hospital, about the diagnosis of their disease the doctors have given them.
1) Name of disease
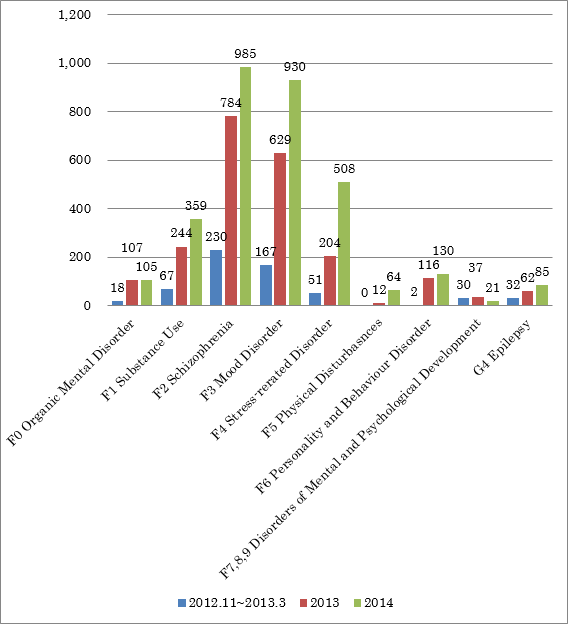
As a result, the most frequent diagnosis was “schidophrenia and delusional disorders.” This diagnosis was given to 230 (36.2%) people in 2012, 784 (33.6%) people in 2013, and 985 (30,0%) people in 2014.
The second most frequent diagnosis was “mood disorders”. The number of people with this diagnosis was 167 (26.3%) in 2012, 629 (26.9%) in 2013, and 930 (28.3%) in 2014.
The third was “neurotic, stress related disorders.” The number of people with this set of disorders was 51 (8.0%) in 2012, 204 (8.7%) in 2013, and 508 (15.5%) in 2014.
The fourth was “psychoactive substance use”. The number of people included in this category was 67 (2.0%) in 2012, 244 (10.4%) in the 2013, and 359 (10.9%) in 2014.
As seen in Chart 4, people diagnosed as having disorders/diseases 1 to 4 mentioned above have been gradually increasing in number year by year. In particular, the rapid two-fold increase in “neurotic,stress-related and somatoform disorders” in the third year post disaster attracts our attention.
2) Time of Onset of Disease
The number of people who reported having some disease prior to the disaster was 32 (5.7%) in 2012, 1,418 (62.8 %) in 2013, and to 1,845 (57.9%) in 2014.
The number of people who developed symptoms after the disaster also increased year by year, from 125 (22.4%) in 2012 to 674 (29.8 %) in 2013 and 1,142 (35.8%) in 2014.
Chart 4. Medical Treatment Rate
9. Group Activities(Chart 5)
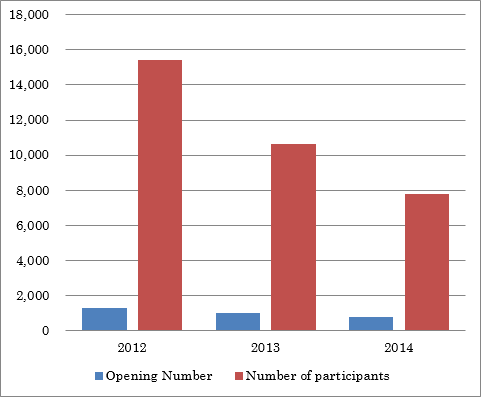
The aims of the group activities we conducted in temporary housing were to prevent feelings of isolation and depression, and to reduce the disuse syndrome of the evacuees.
The group actvities began with health checks such as blood pressure measurements and physical and mental check-ups. After some physical and mental actvities, there followed a period of relaxation and informal chatting.
As seen in Chart 5, the times and the number of participants in these group activities gradually decreased after the peak in 2012.
Chart 5. Group Activities
10. The Geographic Range of Consultation Support
Our center provided consultation support to a wide range of areas including 36 cities, towns and villages inside of Fukushima, 10 prefectures outside of Fukushima and Tokyo. The entire population of Fukushima had access to our mental and emotional support services.
From 2013 to 2014, the total number of consultations was highest in MinamiSoma City; most of these consultations were provided by the Soma City branch office.
The center provided consultation for 2,595 people in 2013 and 2,433 people in 2014 in 8 Futaba county municipalities, which are located near the nuclear power plant where the accident occurred.
These 8 towns were Namie, Futaba, Tomioka, Okuma, Hirono, Katsurao, Kawauchi and Naraha. Since Iitate village and Shinch town were also in high radiation levels, there were high demands for consultation and support services in these two areas as well.
Ⅱ. Support Services for Public Servants (Helping the Helpers)
1. The number of Consultations (Chart 6)
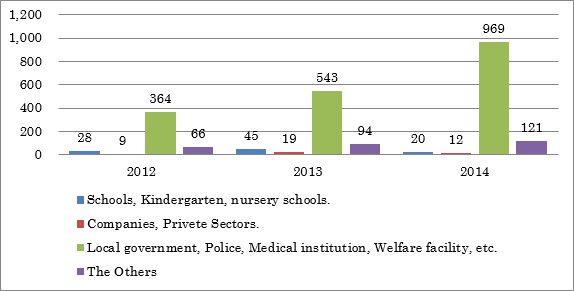
While they and their families were disaster victims themselves, area public servants and other service providers (i.e., staff members at “local public entities, police, school teachers, staff members of hospital and welfare institutions, etc.”) have nonetheless worked ceaselessly to help disaster victims and have, over time, become increasingly exhausted. Our center provides support services for these public servants.
The number of consultations amounted to 364 (77.9%) cases in 2012, 543 (77.5%) cases in 2013, and 969 (86.4%) cases in 2014.
Chart 6. The Number of Consultations
2. The Nature of the Services provided to Public Servants
The number of consultations and advisory interactions given to public servants increased from 33 cases(125 people) in 2012, to 97 cases(507 people) in 2013 and 202 cases (488 people) in 2014.
The number of case conferences that were held with various public servants were 75 in 2012, 266 in 2013, and 297 in 2014.
The number of clients involved in “health support activities” were 27 persons in 2012, 92 persons in 2013 and 115 persons in 2014.
3. Activity to Promote Health Awareness among the Public
To increase public awareness about overall health matters, the center has held lecture meetings every year. The total number of the lecture meetings and participants were 271 meetings (517 people) in 2012, 65 meetings (2,516 people) in 2013, and 50 meetings (1,849 people) in 2014. In addition, the center distributed 196 teaching materials in 2012, 306 materials in 2013, and 578 materials in 2014.
Correspondence to the news media was undertaken 22 times in 2012, 20 times in 2013, and 23 times in 2014. Maintenance to and updates of our website was done 36 times in 2012, 79 times in 2013, and 21 time in 2014.
Ⅲ. Conclusion
The peak year for the number of consultations and support services our center provided for disaster victims was 2012. We conducted home visits and health checks immediately in 2012, in order to extend our medical support and assistance to those disaster victims. The number of consultations and support services increased by 11% in 2014 as compared with 2013. This increase was considered to be the result of our activities becoming gradually known to area residents through distribution of information by the administrative officers and life support advisers.
As the primary method of consultation, we conducted our outreach program. However, the need for private counseling and telephone counseling has been increasing year by year. In order to meet those needs of clients, every branch office has set up a counseling room or corner and has also conducted telephone counseling services through the center office.
In Fukushima, an enormous natural disaster in the form of an earthquake and the accompanying tsunami and a man-made disaster composed of a nuclear accident came in quick succession. The resulting feeling of “complicated loss” among the population may take many years to recover.
In order to support the people of Fukushima and the recovery of the communities, their daily lives, and each individual’s peace of mind, continuing efforts must be made with a longterm perspective in mind.


